


Are you looking to create stunning graphs and charts without spending HOURS manually inputting data?
Look no further! I’ve got you!
AI graph generators are changing data visualization, allowing anyone to quickly transform complex information into easy-to-understand visuals.
In fact, the global data visualization market is expected to reach $19.2 billion by 2027, growing at a CAGR of 10.2% from 2020 to 2027.
Whether you need to visualize sales data, survey results, website analytics, or any other type of information, these AI-powered tools make it fast and easy for marketers, analysts, students, and business professionals to create compelling data-driven content.
Let’s get right into the 12 Best AI Graph Generators!
What are AI Graph Generators?

AI graph generators are tools that leverage artificial intelligence to automatically create charts, graphs, and other data visualizations from raw data or text input. These AI-powered tools can understand natural language prompts or analyze datasets to generate visually appealing and insightful graphs, eliminating the need for manual data entry or coding.
AI graph generators aim to simplify the process of data visualization, making it more accessible and efficient for users across various domains, from business analytics to scientific research and academic presentations.
Top 12 AI Graph Generators of 2024
| S/N | AI Graph Generator | Free Plan | Paid Plan |
|---|---|---|---|
| 1 | Appy Pie’s AI Graph Maker | – | $12/month |
| 2 | Graph Maker.ai | Free | $15/month |
| 3 | Wondershare Mockitt | Free | $12/month |
| 4 | vizGPT | Free | $10/month |
| 5 | ChartAI | Free | N/A |
| 6 | HighCharts GPT | Free | $168/annum(license) |
| 7 | Chartify.it | Free | – |
| 8 | Julius AI | Free | $17.99/month |
| 9 | ChartGPT | Free | $5/20 credits |
| 10 | ChartPixel | Free | – |
| 11 | Mermaid Chart | Free | $6.67/month |
| 12 | Google Sheets | Free | $6/month |
1. Appy Pie’s AI Graph Maker
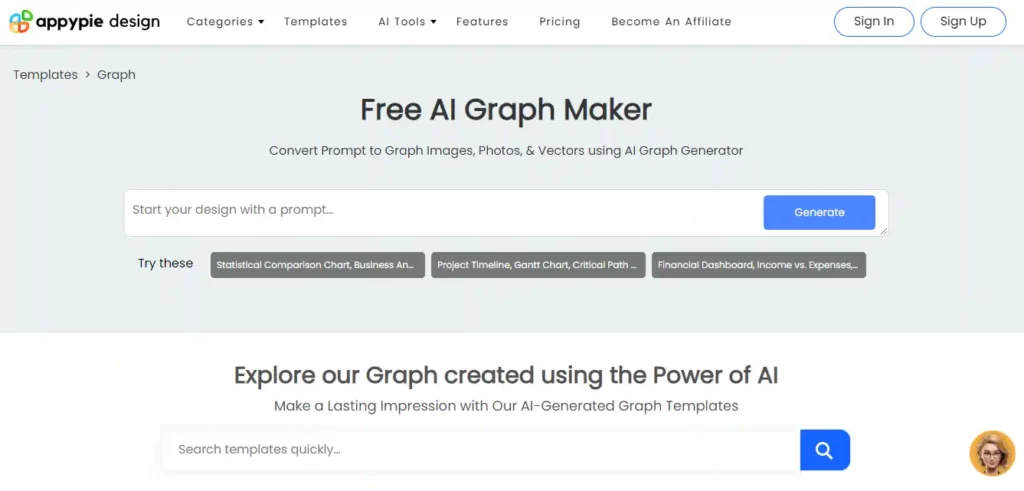
Appy Pie's AI Graph Maker is a powerful tool that simplifies data visualization by transforming text prompts into visually stunning graphs and charts. With its user-friendly interface, users can effortlessly generate a wide range of graph types, including bar charts, line graphs, pie charts, and more, by simply providing a descriptive prompt.
The AI-driven technology analyzes the input, suggests the most suitable graph format, and automatically populates the data, saving users valuable time and effort. Appy Pie's AI Graph Maker offers extensive customization options, allowing users to tailor the graphs to their specific needs, ensuring seamless integration with their brand identity and design aesthetics.
Appy Pie's Key Features
Appy Pie's Pricing
Appy Pie's AI Graph Maker is available as part of the Appy Pie Design platform. The pricing starts at $12 per month for the Single Pricing Plan, which includes access to all AI Magic Features, Editor Features, NFT Features, Personalization Tools, Export Options, Storage, and Support.
Pros and Cons
Pros:
Cons:
2. Graph Maker.ai
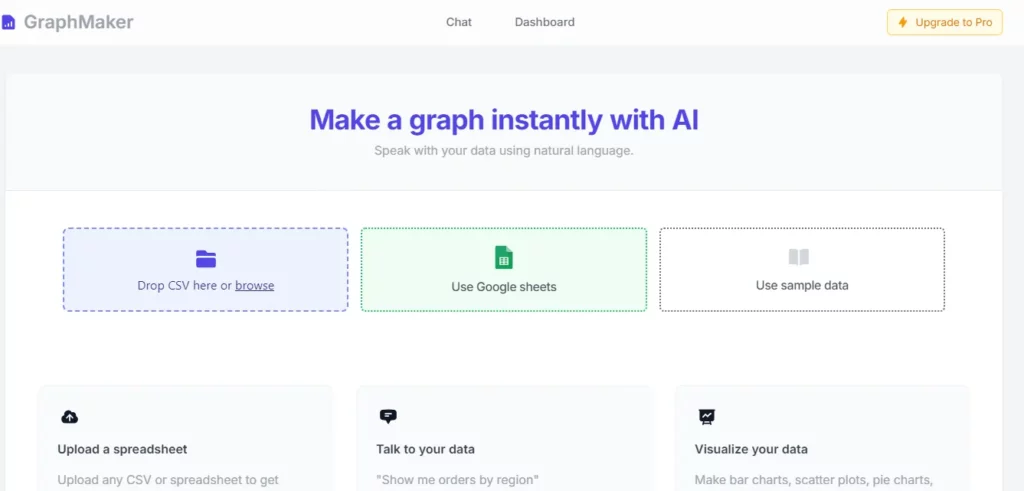
Graphmaker.ai is an AI-powered tool that simplifies the process of creating charts and graphs from data. It allows users to upload Excel files or connect to databases, and the AI automatically generates visually appealing visualizations based on the provided data.
Graphmaker.ai offers a wide range of chart types, including bar charts, line graphs, pie charts, and more. The tool provides intelligent recommendations and allows users to customize the visualizations according to their preferences. With its user-friendly interface and advanced AI capabilities, Graphmaker.ai streamlines data visualization, making it accessible to users of all skill levels.
Graphmaker.ai Key Features
Pricing
Graph Maker offers a free version that allows users to create professional charts. They also offer a Graph Maker Pro plan which costs $15/month. It includes a lot of things from unlimited graph generations, unlimited chat, unlimited chat messages, improved accuracy, etc.
Pros and Cons
Pros:
Cons:
3. Wondershare Mockitt
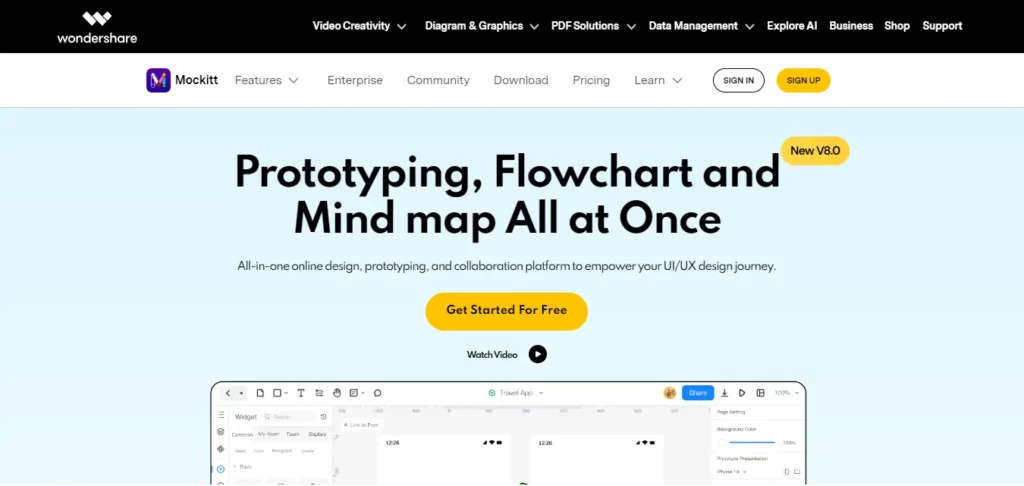
Wondershare Mockitt is a powerful online prototyping and collaboration tool that simplifies the design process. It offers a user-friendly interface with drag-and-drop functionality, allowing designers to create interactive and animated prototypes effortlessly. Mockitt provides a vast library of built-in widgets, icons, and templates, enabling users to bring their ideas to life quickly.
Additionally, it supports real-time collaboration, making it easier for teams to work together seamlessly. With features like version history, code generation, and multiple export options, Mockitt streamlines the entire design workflow, from ideation to handoff.
Wondershare Mockitt Key Features
Wondershare Mockitt Pricing
Wondershare Mockitt provides a free version with basic features and limited access to templates. They offer two paid plans: The Professional plan costs $12/editor/month and is the most popular one; the second paid plan is called Enterprise and is priced at $15/editor/month.
Pros and Cons
Pros:
Cons:
4. vizGPT
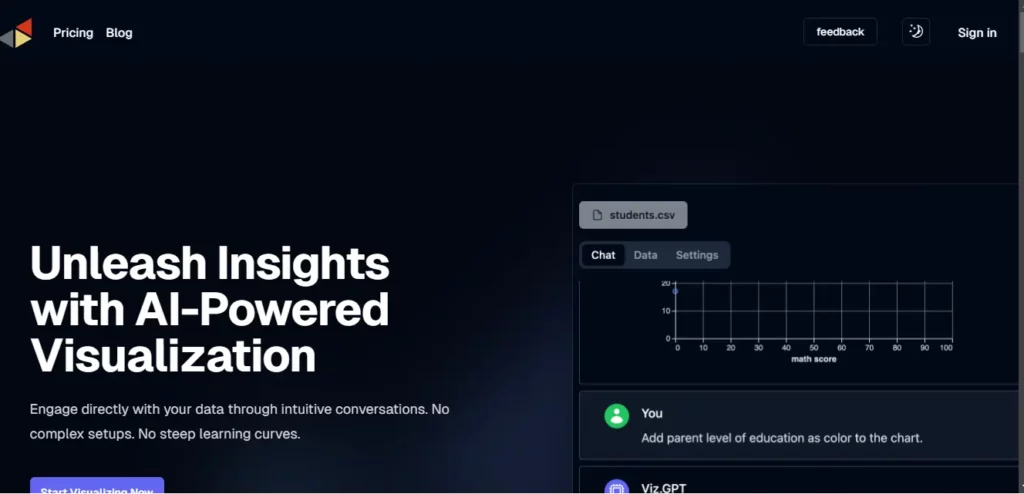
VizGPT is an AI-powered tool that allows users to generate data visualizations, such as charts and graphs, through natural language prompts. It utilzes advanced language models to understand the user's intent and automatically creates visually appealing and insightful visualizations from the provided data.
VizGPT supports a wide range of chart types, including bar charts, line graphs, scatter plots, and more. Users can upload their datasets or connect to various data sources, and the AI will generate the appropriate visualization based on the user's description. With its intuitive chat interface, VizGPT streamlines the process of data exploration and visualization, making it accessible to users of all skill levels.
VizGPT Key Features
VizGPT Pricing
VizGPT offers a flexible pricing model to cater to different user needs. Paid plans start at $10 per month (Professional) and an enterprise plan for custom pricing, offering additional features, templates, and collaboration tools. Both the plans come with a 7-day free trial.
Pros and Cons
Pros:
Cons:
5. ChartAI
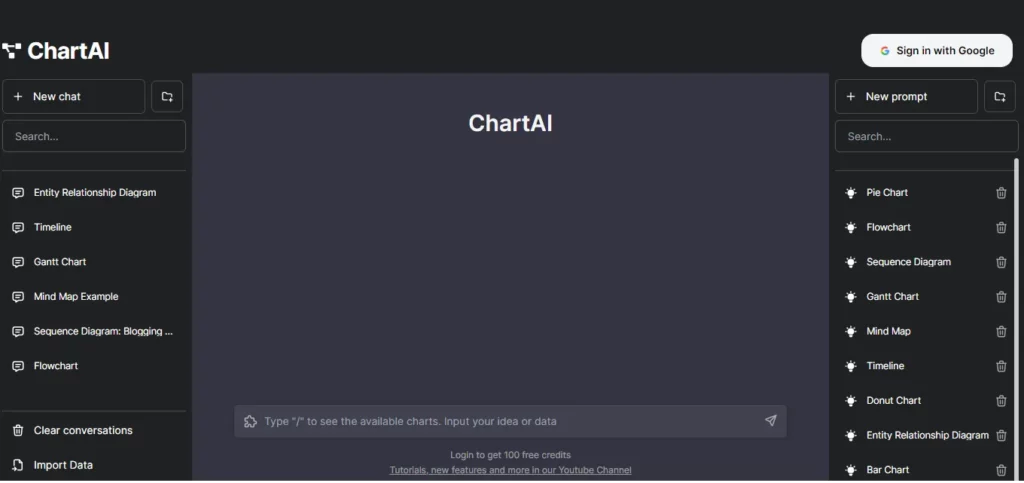
ChartAI is a powerful web-based application that leverages AI to generate insightful charts and graphs from tabular data. Users can upload CSV files or connect to online data sources, and ChartAI will automatically visualize the data in various chart types, including bar charts, line plots, scatter plots, and pie charts.
ChartAI also provides natural language processing capabilities, allowing users to ask questions about their data and receive relevant insights. ChartAI aims to simplify data analysis and visualization, making it accessible to users of all skill levels through its intuitive chatbot interface.
ChartAI Key Features
ChartAI Pricing
Chart AI offers a free version with basic features and limited access to templates.
Pros and Cons
Pros:
Cons:
6. HighCharts GPT
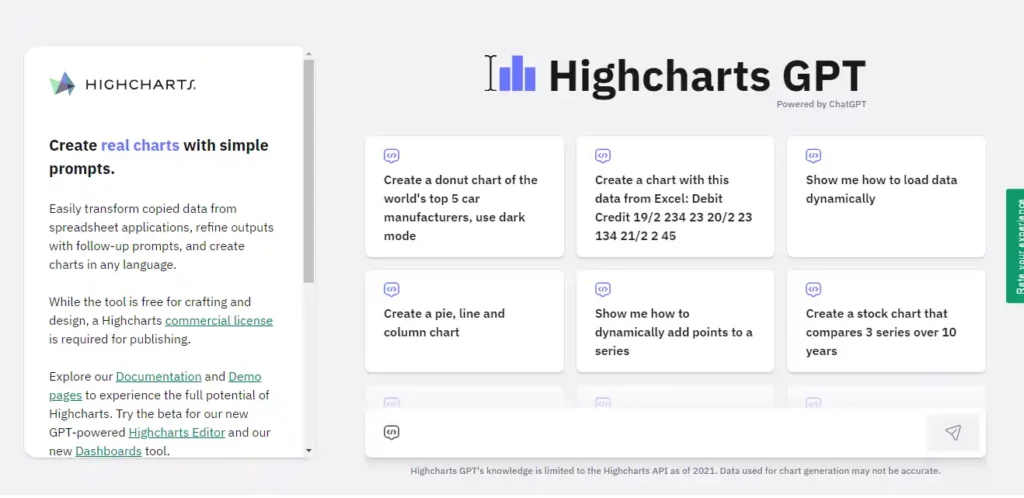
Highcharts GPT is an excellent tool that combines the power of natural language processing with advanced charting capabilities. It allows users to generate interactive and visually appealing data visualizations through simple conversational inputs, eliminating the need for coding.
Powered by ChatGPT, Highcharts GPT offers a user-friendly interface and a wide range of customizable chart types, from line and bar charts to more complex visualizations like financial charts and maps. With robust security features ensuring data confidentiality, Highcharts GPT streamlines the process of transforming raw data into insightful visuals, making it an invaluable asset for developers, data analysts, and professionals across various industries.
Highcharts GPT Key features
Highcharts GPT Pricing
While Highcharts GPT is free for crafting and design purposes, a Highcharts license is required for publishing the generated charts. You can choose between two licences: Annual and Perpetual. The Annual license starts at $168/annum and the Perpetual license costs $368/seat.
Pros and Cons
Pros:
Cons:
7. Chartify.it
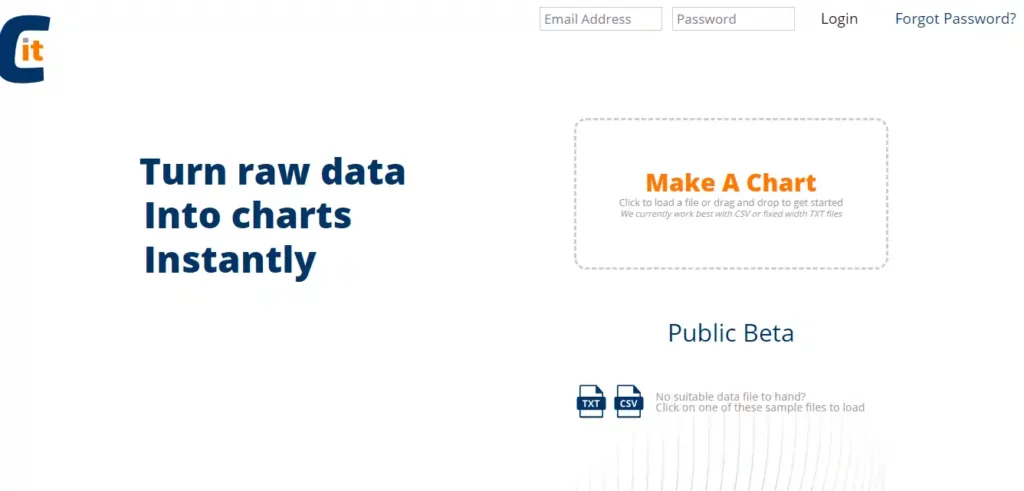
Chartify.it is a web-based AI tool that simplifies the process of creating charts and graphs from data. Users can upload their data files or connect to various data sources, and the AI will automatically generate visually appealing visualizations. Chartify.it supports a wide range of chart types, including bar charts, line graphs, scatter plots, and more.
The tool provides an intuitive interface, allowing users to interact with the generated charts and customize them according to their preferences. With its advanced AI capabilities, Chartify.it aims to make data visualization more accessible and efficient for users across different domains, from business analytics to scientific research.
Chartify.it Key features
Chartify.it Pricing
Chartify.it is currently available as a free tool for crafting and designing charts. However, a commercial license may be required for publishing the generated charts in certain contexts.
Pros and Cons
Pros:
Cons:
8. Julius AI

Julius AI is a powerful AI-powered data analysis and visualization tool that simplifies the process of transforming raw data into insightful charts and graphs. With Julius AI, users can upload their data files or connect to various data sources, and the AI will automatically generate visually appealing visualizations, including bar charts, line graphs, scatter plots, and more.
The tool also offers advanced features such as natural language processing, allowing users to ask questions about their data and receive relevant insights. Julius AI aims to make data analysis and visualization more accessible and efficient for users across different domains, from business analytics to scientific research.
Julius AI Key features
Julius AI Pricing Plans
Julius AI offers a free plan with limited monthly messages, as well as paid plans starting at $17.99 per month for the Basic plan and $37.99 per month for the Essential plan with unlimited messages and exports.
Pros and Cons
Pros:
Cons:
9. ChartGPT
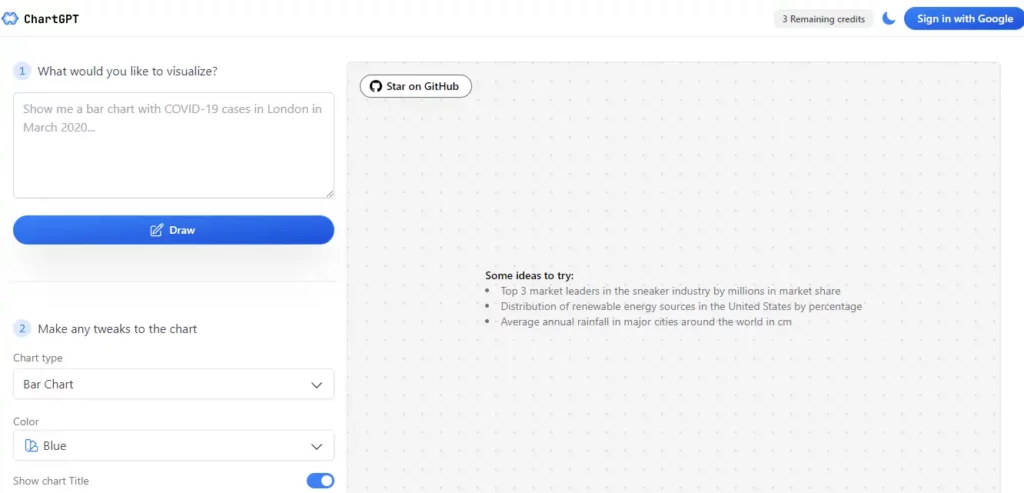
ChartGPT is an innovative AI-powered tool that simplifies the process of creating charts and graphs from data. Users can provide their datasets or connect to various data sources, and ChartGPT will automatically generate visually appealing visualizations through natural language prompts.
ChartGPT supports a wide range of chart types, including bar charts, line graphs, scatter plots, and more. With its intuitive conversational interface and advanced AI capabilities, ChartGPT aims to make data visualization more accessible and efficient for users across different domains, from business analytics to scientific research and academic presentations.
ChartGPT Key features
ChartGPT Pricing Plans
ChartGPT is currently available as an open-source tool, meaning users can access and utilize its features free of charge for limited credits. The pricing starts if you are in need of 20 credits or more. The price ranges from $5 for 20 credits to $80 for 750 credits.
Pros and Cons
Pros:
Cons:
10. ChartPixel
ChartPixel is an AI-powered platform that simplifies data visualization by automatically generating insightful charts and graphs from raw data. Users can upload various file formats, including Excel, CSV, and JSON, and ChartPixel's AI algorithms will clean up messy data, identify relevant columns, and suggest the most meaningful visualizations.
The ChartPixel provides intelligent annotations and summary insights to enhance data comprehension. Additionally, ChartPixel allows users to convert their data insights into visually appealing PowerPoint presentations, streamlining the process of creating compelling data-driven narratives for presentations and reports.
ChartPixel Key features
ChartPixel Pricing Plans
Currently, ChartPixel offers its services in a Free Beta version, making it accessible for users to explore the platform's capabilities without any financial commitment.
Pros and Cons
Pros:
Cons:
11. Mermaid Chart
Mermaid Chart is a powerful text-based diagramming and charting tool that allows users to create complex diagrams using a simple, Markdown-inspired syntax. It supports a wide range of diagram types, including flowcharts, sequence diagrams, class diagrams, state diagrams, and more.
Mermaid Chart offers a collaborative platform for teams to work together on diagrams, with features like real-time collaboration, version control, and simplified sharing. It also provides a visual editor for those who prefer a more traditional drag-and-drop interface. With its open-source roots and enterprise-grade features, Mermaid Chart is an excellent choice for developers, IT professionals, and anyone who needs to communicate ideas visually.
Mermaid Chart Key features
Mermaid Chart Pricing
Mermaid Chart offers its services in a free version, providing users with the opportunity to explore the platform's capabilities without any upfront costs. They also two paid plans: Pro and Enterprise. The Pro plan is priced at $6.67/month and comes with all features of the Free plan, unlimited storage, Visual editor, ChatGPT editor, Multi-user editing etc. The Enterprise plan is priced at $17/month and comes with more advanced features.
Pros and Cons
Pros:
Cons:
12. Google Sheets

Google Sheets is a powerful and versatile spreadsheet application that offers a range of features for data visualization, including the ability to create various types of charts and graphs. With its intuitive interface and seamless integration with other Google Workspace apps, users can easily import data, analyze it, and generate visually appealing charts to effectively communicate insights.
Google Sheets provides a wide array of chart types, such as line, bar, pie, scatter, and more, allowing users to choose the most suitable representation for their data. Additionally, users can customize charts with different colors, labels, and styles, ensuring that the visualizations align with their specific needs and preferences
Google Sheets Key features
Google Sheets Pricing Plans
Google Sheets is available for free as part of Google Workspace's personal plan, with paid plans starting at $6 per user per month for businesses, offering additional storage and features.
Pros and Cons
Pros:
Cons:
Use Cases of AI Graph Generators

Wondering what all can you use AI Graph Generators for?? Here are some of the use cases of AI Graph Generators are listed below:
- Data Analytics and Visualization
AI graph generators are invaluable tools for data analysts and scientists. They simplify the process of transforming complex datasets into meaningful and visually appealing charts and graphs. Users can quickly gain insights, identify patterns, and make data-driven decisions.
- Business Presentations and Dashboards
AI graph makers are ideal for creating compelling business presentations and dashboards. They enable teams to track and visualize key metrics like sales performance, marketing campaigns, and customer data. The interactive and customizable charts help communicate insights effectively to stakeholders.
- Academic Research and Scientific Visualization
Researchers and academics can use AI graph generators to visualize findings from studies and experiments. The tools help present complex information in an accessible format, making it easier to convey the significance of the research.
- Journalism and Reporting
Journalists and reporters can create engaging infographics with AI chart makers to accompany their articles. By presenting data visually, they can better communicate the importance of the story to readers.
- Social Media and Content Creation
Content creators and social media managers can use AI graph makers to produce eye-catching visuals for online content quickly and easily. The tools simplify the process of data visualization for a broad audience.
FAQs Related to Best AI Graph Generators
Can AI Graph Generators Handle Large Complex Datasets?
Many AI graph generators are adept at analyzing large, complex datasets. Some are better suited for this than others. The ability to handle bigger data depends on the specific tool's algorithms and infrastructure.
Are AI-Generated Graphs Always Accurate?
While AI graph generators aim to accurately reflect the input data, it's important for users to review the outputted visualizations for accuracy and make manual tweaks if needed. Providing clear instructions also improves precision.
Do I Need Coding Skills to Use an AI Graph Generator?
Most AI graph generators aim to simplify the creation process and don't require deep technical expertise. Some tools are designed for beginners while others offer both no-code and code-based options for different user needs.
What Types of Graphs can AI Graph Generators Create?
Graph generators can produce a variety of graphs such as bar, line, pie, scatter, and more, depending on the tool.
Do AI Graph Generators Offer Real-time Data Visualization?
Many AI graph generators support real-time data processing, allowing for dynamic and up-to-date visualizations.
Can I Integrate AI Graph Generators with Other Software?
Yes, many AI graph generators offer integration capabilities with popular data management and analytics platforms.
Recommended Readings
End Note
And there you have it!
We've explored some of the best AI graph generators, uncovering tools that turn raw numbers into visual feasts. The above-mentioned tools use advanced AI to create stunning, professional-quality graphs and charts in seconds, saving you time and effort while delivering unmacthed accuracy and consistency.
With their advanced features, intuitive interfaces, and versatile output options, they make data visualization accessible to everyone, regardless of technical expertise.
So why settle for mundane, manually created graphs when you can let AI do the heavy lifting?
Your graphs will never be the same again!